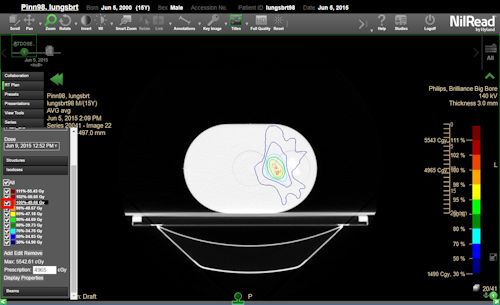
Using the RT Plan panel
When you load a study containing RT plans, when you select a series containing RT plans, RT Plan options are available in the side panel.
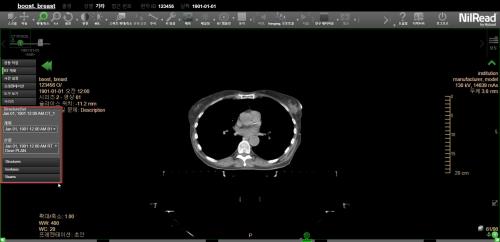
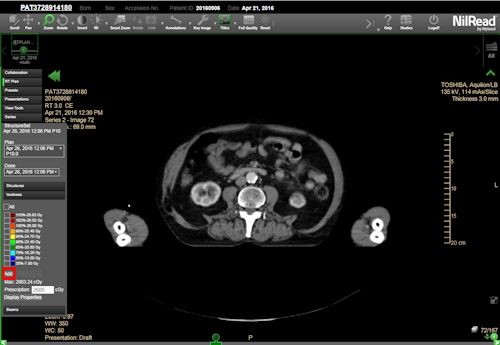
Studies that contain RT plans are marked with an RT icon in their thumbnails.

RT plan options allow you to choose the plan details you want to view.
If the image viewer contains multiple viewports, enable Link (toolbar) to apply the RT Plan options to all viewports. If Link is not enabled, the options will be applied to the currently selected viewport only.
Note
You can use RT templates to control how information is displayed. For details, see Manage RT templates.
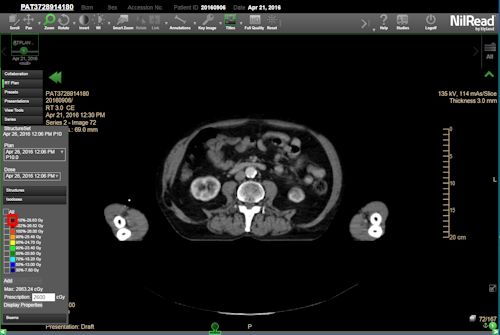
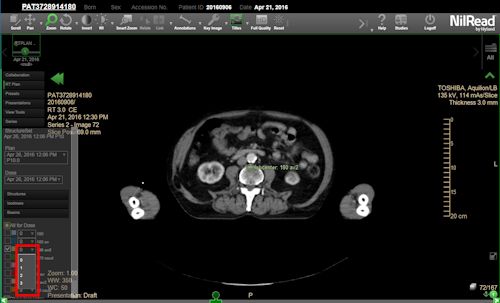
- Select RT Plan (side panel). The RT Plan options appear below the side panel.
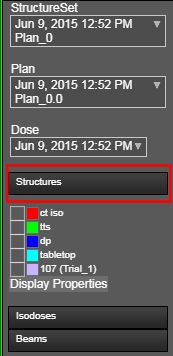
The RT Plan panel allows you to select RT Objects associated with the series.
- Select a StructureSet. The list contains the structure sets associated with the current image series. After you select the structure set, the list of plans is populated with the RT plans that reference the selected structure set.
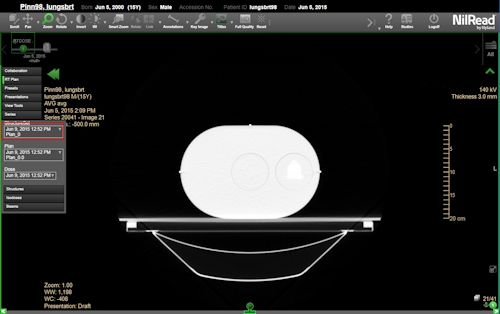
- Select a Plan. After you select a plan, the list of doses is populated with the doses that reference the selected plan.
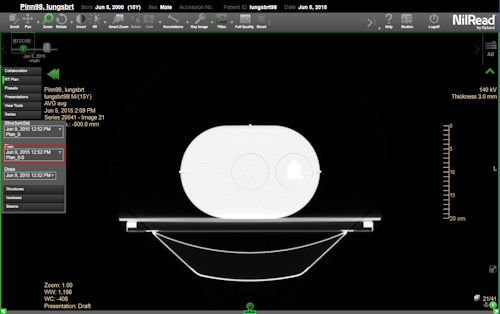
- Select a Dose. Doses can be one of several Summation Types. If the Summation Type of a dose is BEAM, a composite dose is computed from all available BEAM type doses and added to the list of selectable doses. The Summation Type for this composite dose is PLAN.
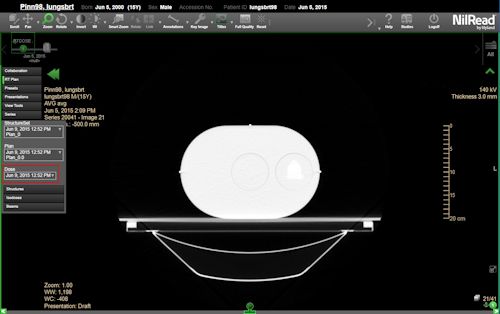
- With a dose selected, you can view the following categories: Structures, Isodoses, and Beams.
Structures
To view options related to structures, click Structures to expand the Structures section.
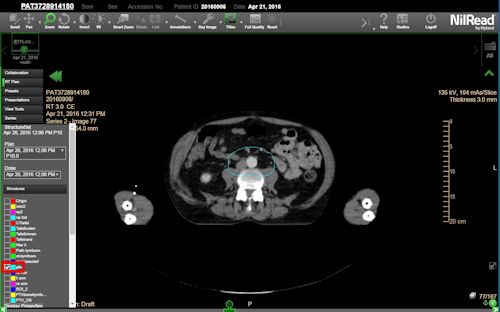
Select the checkbox beside the structures you want to target. The selected structures are contoured.
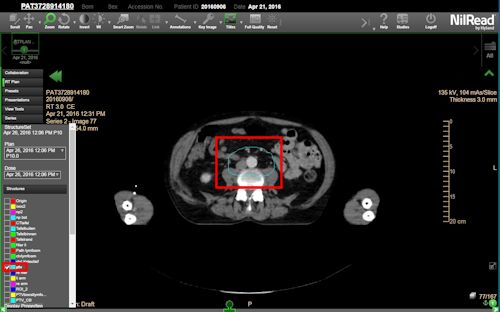
To focus on a structure, select the structure label. (This will also select the structure if it is not already selected.) For 2D views, the viewport is updated to show the first image containing the structure. For slab images, the viewport is updated to show the first location where the structure is visible.
Changing Structure Colors
To change the color of a structure, click the color box beside the structure label. The Structure Color dialog is displayed.
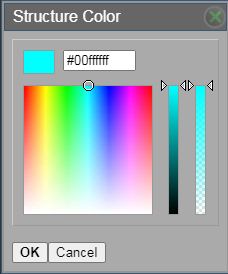
Choose a color by entering the hexadecimal color value or using the color picker. Click OK when finished.
Structure Display properties
You can change the way structures are shown. These changes will last until you close the study. To permanently change the display properties, use an RT template (see Manage RT templates).
-
To change the display properties of a structure, click Display Properties. The Structures Display properties is displayed.
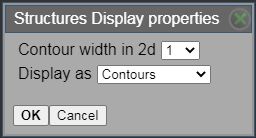
- You can change the following options.
- Contour width in 2d Select the width of the contour outline. Note that you cannot change the contour width for MPR images.
- Display as Select the type of contour: Contours (outline) or Filled Contours (shaded).
- Select OK.
Isodoses
Display properties
You can change the way isodoses are shown. These changes will last until you close the study. To permanently change the display properties, use an RT template (see Manage RT templates).
- Select Isodoses, then select Display Properties. The Isodoses Display properties dialog is displayed.
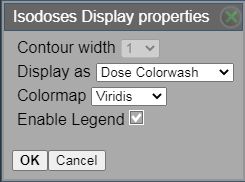
- You can change the following options.
- Contour width Select the width of the contour outline. Note that you cannot change the contour width for MPR images.
- Display as Select the type of display: Contours (outline), Filled Contours (shaded), Dose Colorwash, or Isodose Colorwash.
- Colormap Select the type of colormap: Rainbow, Plasma, or Viridis.
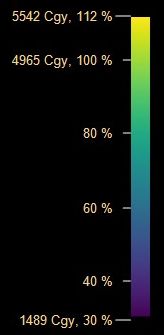
- Enable Legend If this option is selected, the colormap legend is displayed in the viewport.
- Select OK.
Contours and Filled Contours
Isodose levels are shown as a percentage of the prescription dose. The first item in the isodose list is the Maximum isodose level, which represents isodose levels that are above the maximum level. You cannot modify the Maximum isodose level except to change the color.
Select the checkbox beside the isodose levels you want to target. The selected levels are contoured.
To focus on an isodose, select the isodose label. (This will also select the isodose if it is not already selected.) For both 2D views and slab images, the viewport is updated to focus on the centroid of the isodose.

You can add an isodose level.
- Select Add.
- Enter the level (as a percentage of the prescription dose) and select a color.
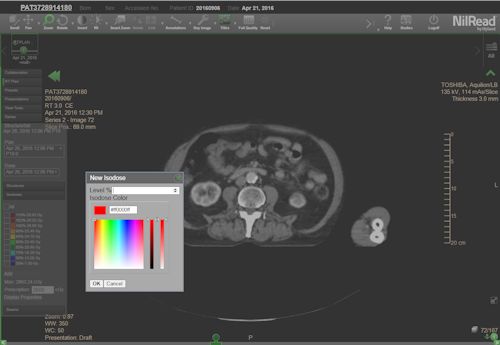
- Select OK.
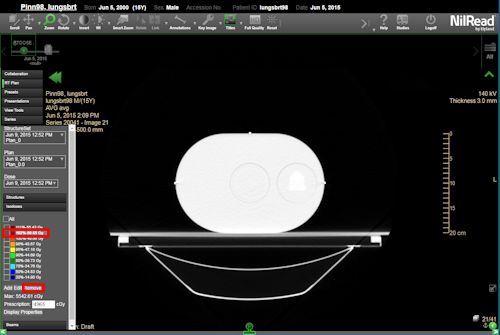
You can change an isodose level.
- Select the isodose label, then select Edit.

- Enter the new level (as a percentage of the prescription dose).
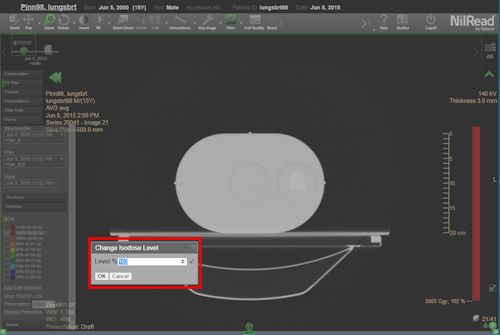
- Select OK.
You can delete an isodose level. Select the isodose label, then select Remove.
Color options for contours and filled contours
You can change the color used to display an isodose. These changes will last until you close the study. To permanently change the display colors, use an RT template (see Manage RT templates).
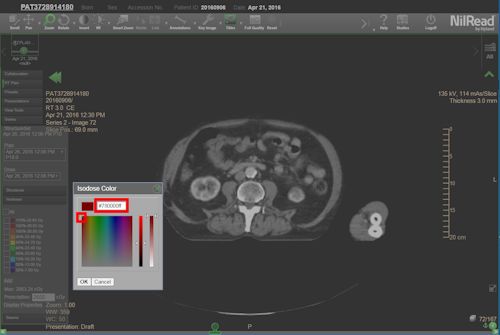
- Click (or tap) the color box beside the isodose.
- Select a color by entering the hexadecimal color code or using the color picker.
- Use the sliders to adjust the color tone and opacity.
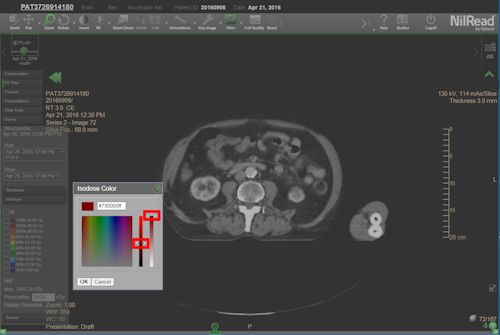
- Select OK.
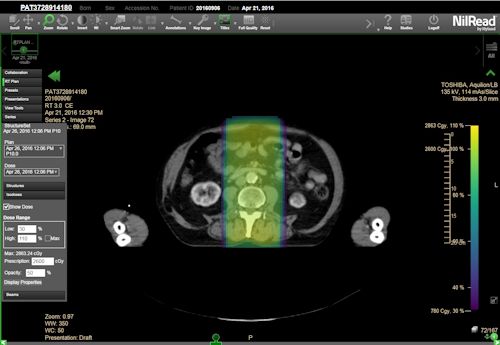
Dose Colorwash and Isodose Colorwash
The colorwash modes show the original, not resampled RT dose blended with the image series. Before blending, the dose data is colored by applying a color lookup table to the dose values.
The Dose Colorwash applies the LUT to a contiguous set of dose values within a range of minimum and maximum dose values, that is a percentage of the prescription.
The Isodose Colorwash applies the LUT to isodose regions and as a result the blended image may appear pixelated depending on the resolution of the dose data.
To show the colowash dose, select Show Dose.
You can enter the dose range to view the affected areas.
-
In the Low field enter the minimum value of the range you want to view.
-
In the High field enter the maximum value of the range you want to view. If you want to set the maximum value to be equal to the maximum dose, select the Max option.
You can change the value of the prescription dose in the Prescription Dose field.
You can change the percentage of the opacity of the colorwash in the Opacity field.
Beams
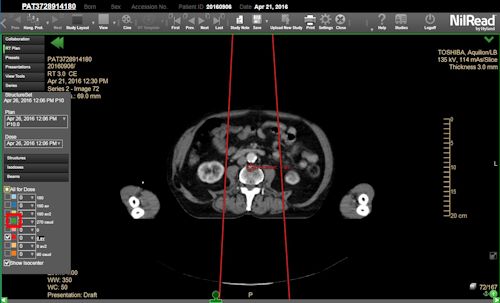
Select the checkbox beside the beams you want to target. The selected beams are shown.

Use the list beside a beam to select the control point you want to visualize. Note that the shape and source of the beam may change between control points.
To focus on a beam, select the beam label. (This will also select the beam if it is not already selected.) For both 2D views and slab images, the viewport is updated to focus on the location of the current beam control point.
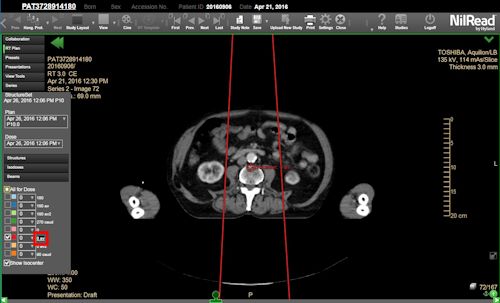
You can display all the beams for the dose by selecting All for Dose.
You can specify whether the isocenter is displayed by selecting Show Isocenter.
Color options
You can change the color used to display a beam. These changes will last until you close the study. To permanently change the display colors, use an RT template (see Manage RT templates).
- Click (or tap) the color box beside the structure, beam or isodose.
- Select a color by entering the hexadecimal color code or using the color picker.
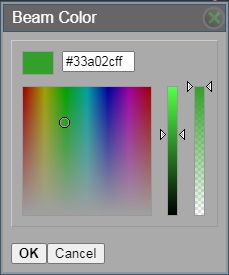
- Use the sliders to adjust the color tone and opacity.
- Select OK.