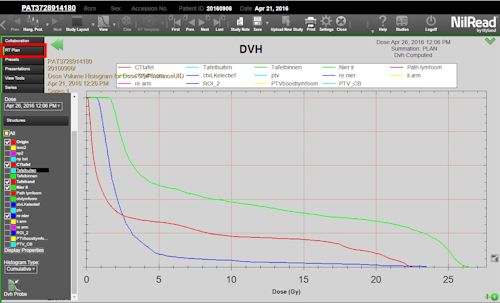
Using the RT Graph view
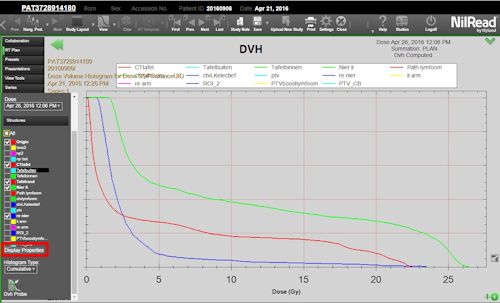
The RT Graph view includes a dose-volume histogram (DVH), representing the distribution of a dose within a structure. You can choose to view a cumulative DVH or a differential DVH. You can also select the structures to include in the histogram.
- Select View (toolbar). Under RT Views, select RT Graph.
Note
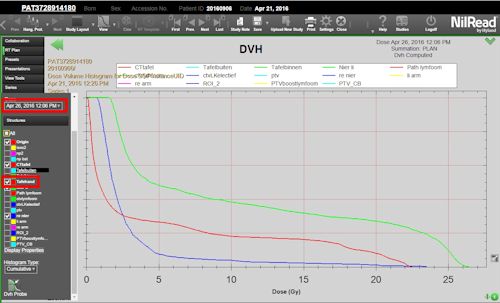
You can also use the study layout options to place the RT Graph view beside an existing view. For details, see Arrange images. - Select RT Plan (side panel). The RT Plan options appear below the side panel.
- Under Histogram Type, select Cumulative or Differential.
- Select a dose, then select one or more structures.
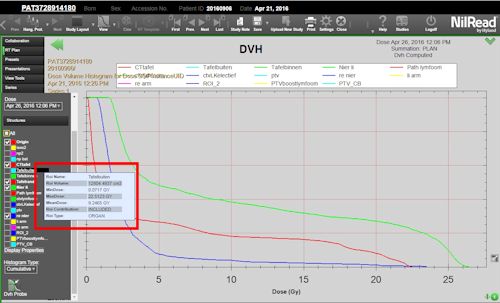
- Hover over a structure in the side panel to view dose statistics.
- You can use Zoom (toolbar) to zoom in and out on the graph. You can also use Pan (toolbar) to pan the graph horizontally.
Using the DVH Probe
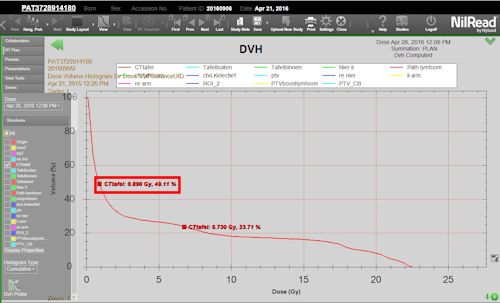
You can use the DVH Probe to view values for a point on a curve.
- Select DVH Probe.
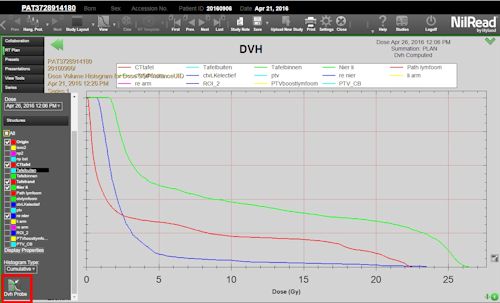
- Hover over a point on a curve. The dose and volume are shown.
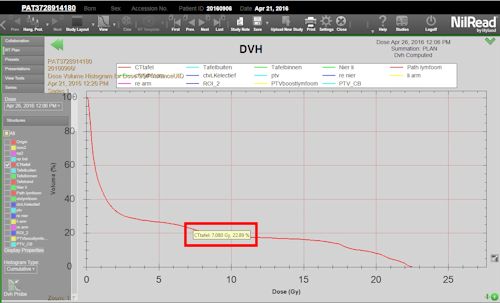
- Click (or tap) a point on a curve. A marker is shown on the curve along with the dose and volume. You can select multiple points. To remove a point, click (or tap) the point on the curve.
Display properties
You can change the dose unit of measurement on the graph.
- Select Display Properties.
- Select the unit of measurement for dose values. You can choose cGy, Gy or a percentage of the prescription dose.
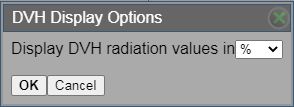
- Select OK.
Structure color options
You can change the color used for a structure. For details, see Using the RT Plan panel.