Use ECG views
NilRead provides several views that can be used to review 12-lead electrocardiogram (ECG) images.
- Open an ECG study.
- (Optional) In the View menu, select the ECG leads you want to view.
- In the View menu, select an ECG View. You can choose from standard views such as Rhythm and 3x4.
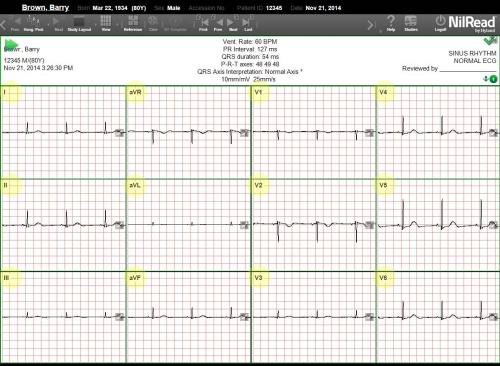
The following information is shown in the information bar above the image.
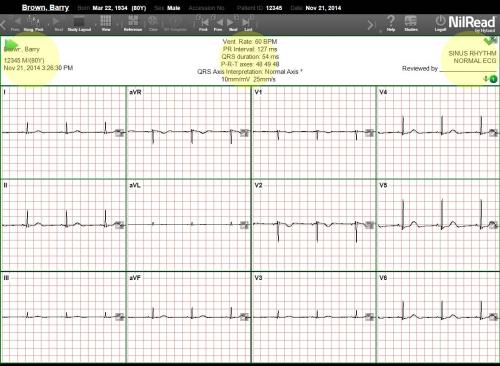
- Patient demographics (patient name, study date, etc.) are shown in the top-left corner.
- Metrics (ventricle rate, PR interval, etc.) are shown in the center. These metrics are taken from the study's DICOM attributes, with the exception of QRS Axis Interpretation, which is calculated by NilRead. For details, see Understanding QRS Axis Interpretation.
- Any comments are shown in the top-right corner.
To expand the information bar, double-click the bar or click  in the top-right corner. To return the information bar to its original size, double-click the bar again or click .
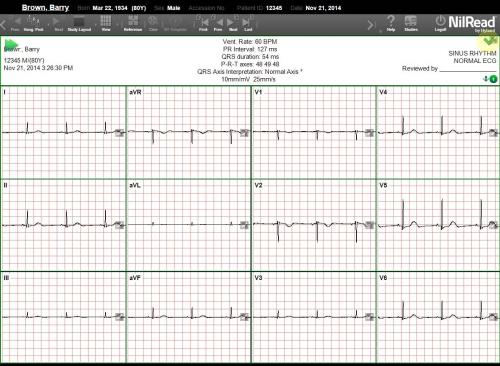
The lead name is shown in the top-left corner of each graph.
Understanding QRS Axis Interpretation
The QRS axis interpretation is calculated using the "Three Lead Analysis (Lead I, Lead II and aVF)" method of ECG axis interpretation. Using this method, the QRS axis is determined to be normal, LAD Physiological, LAD Pathological, RAD, Extreme Axis, or Indeterminate.
The following table summarizes how the QRS axis is calculated.
|
|
Normal Axis 0 to +90° |
LAD Physiological 0 to -30° |
LAD Pathological -30° to -90° |
RAD 90° to 180° |
Extreme Axis -90° to -180° |
Indeterminate ? |
|---|---|---|---|---|---|---|
|
LEAD I |
POSITIVE |
POSITIVE |
POSITIVE |
NEGATIVE |
NEGATIVE |
EQUIPHASIC |
|
LEAD II |
POSITIVE |
EQUIPHASIC |
NEGATIVE |
POSITIVE |
NEGATIVE |
EQUIPHASIC |
|
LEAD III or aVF |
POSITIVE |
NEGATIVE |
NEGATIVE |
POSITIVE |
NEGATIVE |
EQUIPHASIC |